Daylight
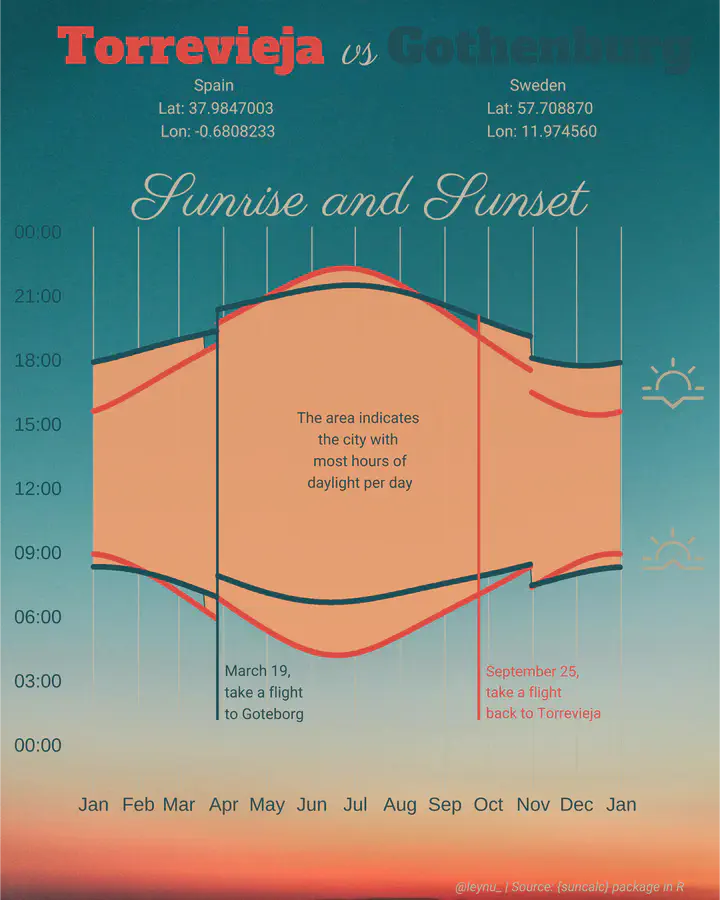
Sunrise and Sunset in Torrevieja (Spain) and Gothenburg (Sweden). The code can also be found here:
## -----------------------------------------------
## Sunrise and Sunset in Torrevieja and Gothenburg
## Author: Leyla Nunez
## Date Created: 2022-01-30
## -----------------------------------------------

# loading needed packages
pacman::p_load(tidyverse, lubridate, suncalc,
               ggplot2, cowplot, here,
               showtext)

showtext_auto()
font_add_google("Alfa Slab One")
font_add_google("Parisienne")
font_add_google("Roboto")

font1 <- "Alfa Slab One"
font2 <- "Parisienne"
font3 <- "Roboto"

got <- getSunlightTimes(date = seq.Date(as.Date("2021-01-01"), as.Date("2021-12-31"), by = 1),
                 keep = c("sunrise", "sunset"),
                 lat = 57.708870, lon = 11.974560, tz = "CET") %>%
  mutate(city = "Gothenburg")

ali <- getSunlightTimes(date = seq.Date(as.Date("2021-01-01"), as.Date("2021-12-31"), by = 1),
                        keep = c("sunrise", "sunset"),
                        lat = 37.9847003, lon = -0.6808233, tz = "CET") %>%
  mutate(city = "Torrevieja")

data <- bind_rows(got, ali) %>%
  gather(condition, measurement, sunrise:sunset) %>%
  select(-c(lat, lon)) %>%
  arrange(city, date, condition) %>%
  mutate(x = as.Date(ymd(date)),
         measurement = ymd_hms(paste0("2022-01-01 ",
                                      as.character(format(measurement, format = "%H:%M")),
                                      ":00"))
         ) %>%
  mutate(paired = rep(1:(n()/2), each=2)) %>%
  group_by(city, date) %>%
  mutate(sun_hours = max(measurement) -min(measurement)) %>%
  ungroup()

# keeping information about the country with most hours of daylight per day
sun_hours_max <-  data %>%
  group_by(date) %>%
  slice_max(sun_hours) %>%
  mutate(min = min(measurement),
         max = max(measurement)) %>%
  ungroup() %>%
  select(x, min, max) %>%
  unique()

data <- data %>%
  left_join(sun_hours_max)


# plot
p <- data %>%
  ggplot(aes(x= x, y= measurement, color = city)) +
  geom_ribbon(aes(ymin= min, ymax = max), fill= "#f2af83",
              alpha = 0.75
              )+
  geom_point(aes(group = city, color=city), size = 2) +


  theme_half_open(12) +
  theme(plot.margin = margin(8, 2.6, 3, 0.5, "cm"),
        legend.position='none',
        panel.grid.minor=element_blank(),
        panel.grid.major.y=element_blank(),
        panel.grid.major.x=element_line(color = "#c7c5b4",
                                        size = 0.5),
        panel.border = element_blank(),
        axis.ticks = element_blank(),
        axis.line = element_blank(),
        axis.title.y = element_blank(),
        axis.title.x = element_blank(),
        axis.text.x = element_text(size = 19,  color = "#25616a",
                                   vjust = 1 ),
        axis.text.y = element_text(size = 19,
                                   hjust = 0,
                                   color = "#25616a")
        ) +
  scale_x_date(date_labels = "%b",
               date_breaks = "1 month")  +
  scale_y_datetime(date_labels = "%H:%M",
                   date_breaks = "3 hour",
                   limits=as.POSIXct(c('2022-01-01 00:00:00','2022-01-02 00:02:00'))) +
  scale_color_manual(values = c("#e56255", "#25616a", "#e56255", "#25616a"))


# Using ggdraw
ggdraw() +
  draw_image(file.path(here("background.jpeg")),
             scale =1) +
draw_plot(p) +
  draw_image(file.path(here("sunrise.png")),
             x = 0.435, y = -0.11, scale = .087) +
  draw_image(file.path(here("sunset.png")),
           x = 0.435, y = 0.074, scale = .087) +
  draw_text(text= "Torrevieja",
            x=0.265,
            y=0.95,
            size=48,
            family=font1,
            hjust = 0.5,
            color="#e56255") +
  draw_text(text= "Gothenburg",
          x=0.75,
          y=0.95,
          size=48,
          family=font1,
          hjust = 0.5,
          color="#25616a") +
  draw_text(text= "Sunrise and Sunset",
          x=0.5,
          y=0.785,
          size=60,
          family=font2,
          hjust = 0.5,
          color="#c7c5b4") +
  draw_text(text= "vs",
          x=0.5,
          y=0.95,
          size=54,
          family=font2,
          hjust = 0.5,
          color="#c7c5b4") +
  draw_text(text= "Spain \n Lat: 37.9847003 \n Lon: -0.6808233",
          x=0.3,
          y=0.88,
          size=16,
          family=font3,
          hjust = 0.5,
          color="#c7c5b4") +
  draw_text(text= "Sweden \n Lat: 57.708870 \n Lon: 11.974560",
            x=0.75,
            y=0.88,
            size=16,
            family=font3,
            hjust = 0.5,
            color="#c7c5b4") +
  draw_text(text = "@leynu_ | Source: {suncalc} package in R",
          x=0.95,
          y=0.015,
          family=font3,
          color="#c7c5b4",
          size=13,
          fontface = "italic",
          hjust = 1) +
  draw_line(
    x = c(0.302, 0.302),
    y = c(0.2, 0.653),
    color = "#25616a",
    size = 1.25
  ) +
  draw_text(text= "March 19, \ntake a flight \nto Goteborg",
          x=0.312,
          y=0.231,
          size=15,
          family=font3,
          hjust = 0,
          color="#25616a") +
  draw_line(
    x = c(0.665, 0.665),
    y = c(0.2, 0.65),
    color = "#e56255",
    size = 1.25
  ) +
  draw_text(text= "September 25, \ntake a flight \nback to Torrevieja",
            x=0.675,
            y=0.231,
            size=14.5,
            family=font3,
            hjust = 0,
            color="#e56255") +
  draw_text(text= "The area indicates \nthe city with \n most hours of \ndaylight per day",
            x=0.5,
            y=0.5,
            size=15,
            family=font3,
            hjust = 0.5,
            color="#25616a")

# Saving
ggsave("~/Desktop/daylight.png",
       width = 10,
       height = 12.5)