Coffee

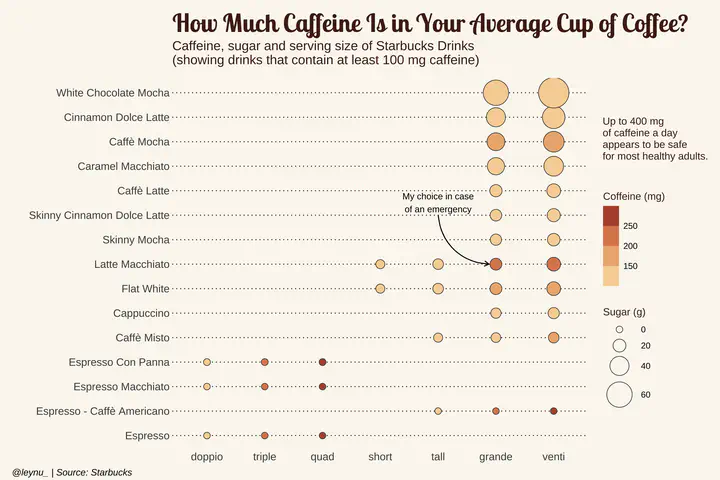
A bubble plot using Starbucks data
# Libraries
library(tidyverse)
library(camcorder)
library(MetBrewer) #Met Palette Generator
# The dataset is provided in the gapminder library
library(ggplot2)
library(hrbrthemes)
library(viridis)
library(showtext)
library(sysfonts)
library(ggstream)
library(cowplot)

# Adds
showtext_auto()
font_add_google("Six Caps")
font_add_google("Fira Sans Extra Condensed")
font_add_google("Lobster Two")

font1 <- "Six Caps"
font2 <- "Fira Sans Extra Condensed"
font3 <- "Lobster Two"

starbucks <- readr::read_csv('https://raw.githubusercontent.com/rfordatascience/tidytuesday/master/data/2021/2021-12-21/starbucks.csv')

remove.list <- paste(c("Tea", "Frappuccino", "Refreshers", "Chai",
                       "Iced", "Ice", "Cold", "Brewed"), collapse = '|')

caff <- starbucks %>%
  distinct(product_name, size, serv_size_m_l, sugar_g, caffeine_mg) %>%
  filter(caffeine_mg > 100) %>%
  group_by(product_name, size) %>%
  filter(sugar_g == max(sugar_g)) %>%
  ungroup() %>%
  arrange(product_name, size, sugar_g) %>%
  mutate(
    product_name = fct_reorder(str_to_title(product_name), sugar_g),
    serv_size_m_l = case_when(
      size == "solo" ~ 22,
      size == "doppio" ~ 44,
      size == "triple" ~ 65,
      size == "quad" ~ 89,
      TRUE ~ serv_size_m_l
    )
  ) %>%
  filter(!str_detect(product_name, remove.list)) %>%
  mutate(product_name = droplevels(product_name))


caff2 <- caff %>%
  arrange(desc(caffeine_mg)) %>%
  group_by(caffeine_mg) %>%
  mutate(typefill = if_else(row_number() == 1, 1, 0)) %>%
  ungroup() %>%
  mutate(typefill = cumsum(typefill))

p_title <- "How Much Caffeine Is in Your Average Cup of Coffee?"
p_subtitle <- "Caffeine, sugar and serving size of Starbucks Drinks \n(showing drinks that contain at least 100 mg caffeine)"
pal <- met.brewer("OKeeffe2", type = "continuous")

# Bubble plot
p <- caff2 %>%
  ggplot(aes(x=reorder(size, as.numeric(serv_size_m_l)),
             y=reorder(product_name, as.numeric(sugar_g)) ,
             size = sugar_g,
             fill=caffeine_mg)) +
  geom_point(alpha=1, shape=21, color = "#4D4D4D") +
  scale_radius(range = c(3, 15)) +
  scale_fill_stepsn(colors = pal, name = "Coffeine (mg)") +
  labs(title = p_title,
       subtitle = p_subtitle,
       size = "Sugar (g)") +
  theme_ipsum() +
  theme(plot.background = element_rect(fill="#fbf7f0",
                                       color="#fbf7f0"),
        plot.margin = margin(0.5, 5, 0.75, 1.1, "cm"),
        plot.title = element_text(size = 27,
                                  family=font3,
                                  face = "bold",
                                  color="#4f2217"),
        plot.subtitle = element_text(size = 14,
                                     color="#4f2217"),
        legend.position = c(1.115, 0.4),
        legend.title = element_text(size = 11,
                                    color="#4f2217"),
        panel.grid.major.x = element_blank(),
        panel.grid.major.y=element_line(size = 0.5,
                                      linetype = "dotted",
                                      color = "#4f2217"),
        axis.title.x = element_blank(),
        axis.title.y = element_blank()) +
  annotate(geom = "text",
           x = 5,
           y = 10.51,
           label = "My choice in case\nof an emergency",
           hjust = 0.5,
           size = 3.4,
           fontface = 1 ) +
  annotate(geom = "curve",
           xend = 5.88,
           yend = 8,
           x = 5,
           y = 10,
           curvature = 0.4,
            arrow = arrow(angle = 30, length = unit(0.2, "cm")))

ggdraw(p) +
  draw_text(text= "Up to 400 mg \nof caffeine a day \nappears to be safe \nfor most healthy adults.",
            x=0.837,
            y=0.755,
            size=11,
            hjust = 0,
            color="#4f2217",
            lineheight = 0.95,
            vjust = 1
            )  +
  draw_text(text = "@leynu_ | Source: Starbucks",
            x=.1, y=0.016,
            size=10,
            fontface="italic"
  )

ggsave("~/Desktop/coffee.png",
       width =10.77,
       height=7.18)